| 5.2 Visuals | ||
|---|---|---|
| Chapter 5. Miscellaneous | | |
| 5.2 Visuals | ||
|---|---|---|
| Chapter 5. Miscellaneous | | |
The tools for visual representation were already introduced in 2.2.4.3. Here, we'll examine how to control a canvas.
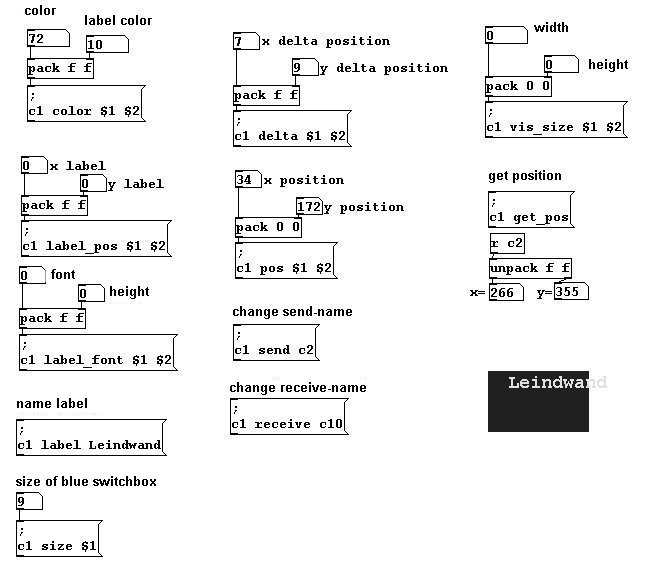
Create a canvas (Put Canvas) and give it the receive symbol "c1" under properties (right-click on the box in the canvas's upper left):

Now you can send the canvas messages:
This should be clear from the previous material: a tidy patch comprises the main window and subpatches (cf. 3.4.2.4 and 5.1.1.1). In this manual, I've usually refrained from this sort of organization for the sake of clarity (it's easier to comprehend a graphic when all the required information is present in just one window).
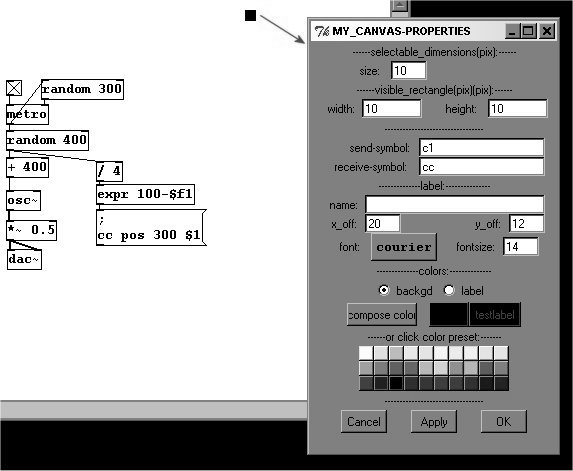
The colorful elements in canvasses can greatly enhance the clarity of your patches (cf. 3.4.2.4). For displaying functions, they can also be used in variable manner. For example, you could display the results of a random generator like this:
patches/5-2-2-2-canvas-display.pd
You could also display a number in a larger size (however, a symbol must always accompany the number; here, a ">" is used):
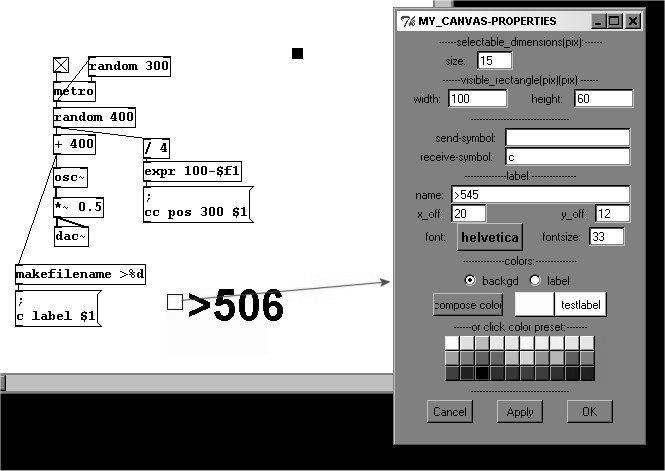
The possibilities are nearly endless; you could even produce complete graphic scores using canvasses.
Canvasses can be laid over other GUI objects; the order in which they are created is critical. You could make your own toggles:
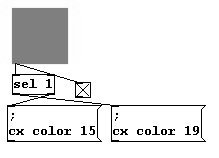
First, a toggle with a size of 55 was created and attached to "sel 1". Then, a canvas with a size of 55 and a receive symbol "cx" was created and superimposed directly on top of the toggle (the order of creation is essential; otherwise, the canvas disappears behind the toggle). The "sel 1" object and all the rest could be separated into a subpatch and an internal "send" object for the toggle could be used.
Here again, the possibilities are endless. To name just one example, you could replace an octave of piano keys like this (clearly, I am not the most talented Pd graphic designer):
patches/5-2-2-3-piano-display.pd
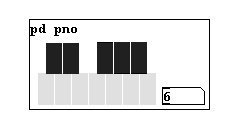
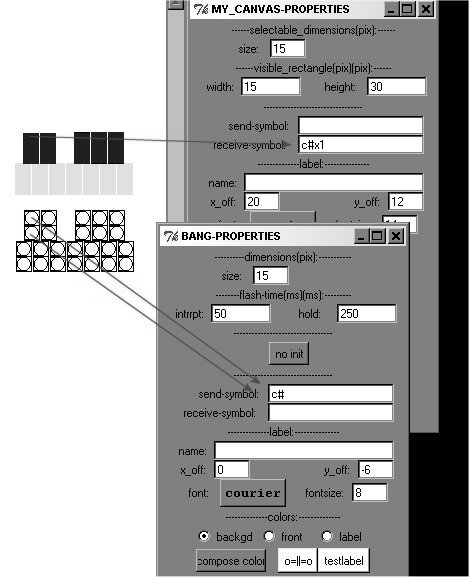
The subpatch contains:
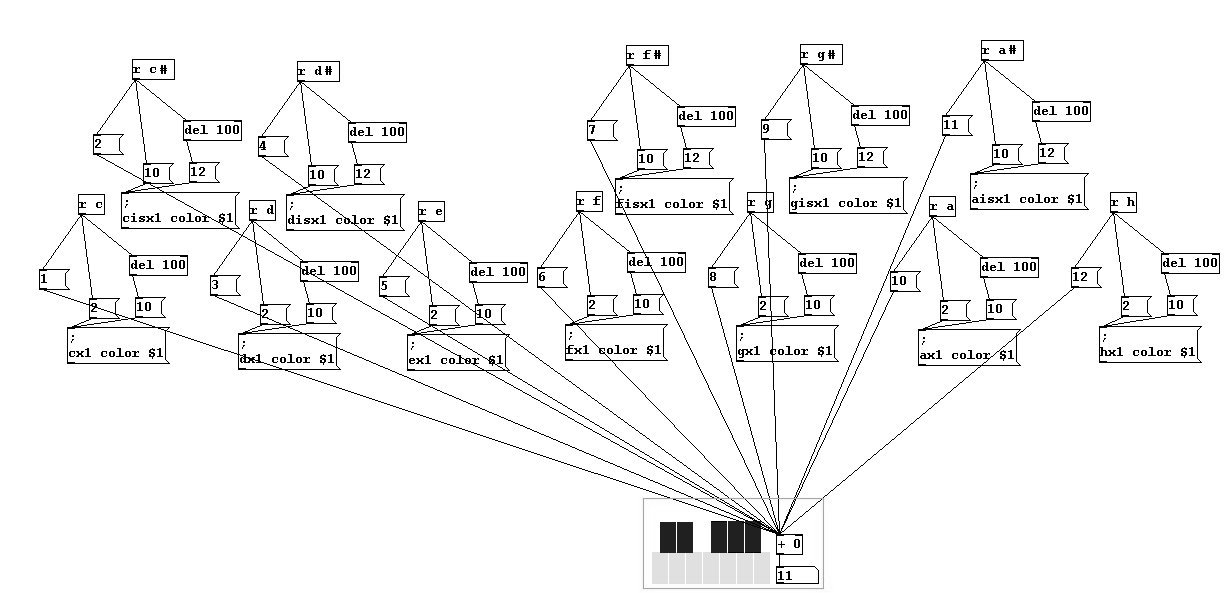
Behind the 'piano keys' is a series of bangs:
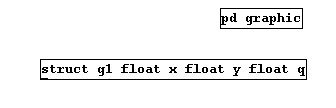
Data structures are an entire family of graphics in Pd.
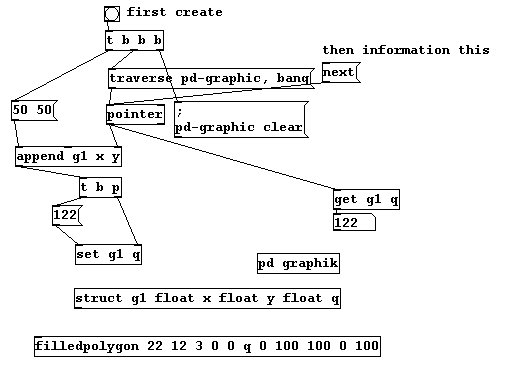
You can place graphic elements in a subpatch. First you create the subpatch "graphic" and define variables and a graphic for this subpatch. This is called a "template". It contains the variables with "struct"; for its argument, enter the template's name (here "g1") and then pairs comprising type and name - in this case, float x float y float q. "float" is the type (a decimal number); x, y, and q are freely chosen names.
The graphic can be defined with the objects "drawcurve", "drawpolygon", "filledcurve", and "filledpolygon". Let's use "filledpolygon" for our first example. A polygon is a geometric shape with many sides. The arguments from left to right are interior color, perimeter color, perimeter width, pairs of coordinate points (starting from upper left and proceeding clockwise).
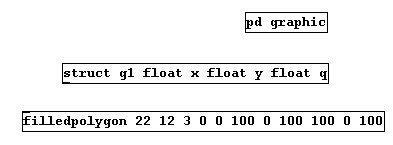
To create a graphic, we need "append". Its first argument is the template's name and then possible variables - x and y should always be used. The right input is the place in the subpatch where the graphic is to be placed. You have to imagine that graphic elements in a subpatch are ordered one after another as in a list. "append" must first know the place in the list that the "pointer" object has named. Give "pointer" the Message "traverse pd-graphic"; this causes "pointer" to go to the beginning of the list. A "bang" message will send this place on the list (to "append"). Then give data for the variables into the "append" object's left inlet.
patches/5-2-3-1-data-structures1.pd
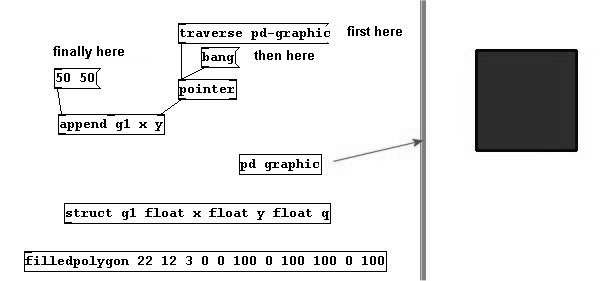
Just for the sake of clarity: "x" and "y" are special names for a graphic element used in data structures. It defines an absolute position, 50/50. You've now created a "filledpolygon" with the interior color 22, the perimeter color 12, the perimeter width 3, and with 4 points: upper left at a distance of 0/0 from the absolute position, upper right at a distance of 100/0 from the absolute position, lower right at 100/100, and lower left at 0/100. If you simply removed the last two numbers from "filledpolygon", you'd be left with a triangle. You can apply this same method to create a polygon with any number of sides.
"traverse pd-graphic" basically takes you right to the beginning of the subpatch "graphic"; a "bang" sends this position to "append" and, when we send it data with the necessary variables, "append" creates the graphic at this position.
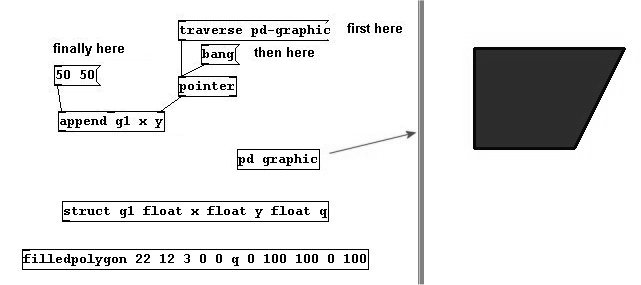
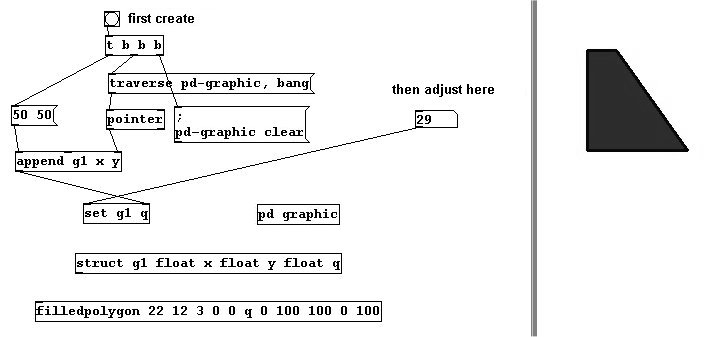
But you could also change something about this graphic. You defined the variable "q" (a float) for the template "g1". Now enter the following for the "filledpolygon": "filledpolygon 22 12 3 0 0 q 0 100 100 0 100". One point has just one variable. The point disappears and you now have a triangle. This variable can be set using "append":
patches/5-2-3-1-data-structures2.pd
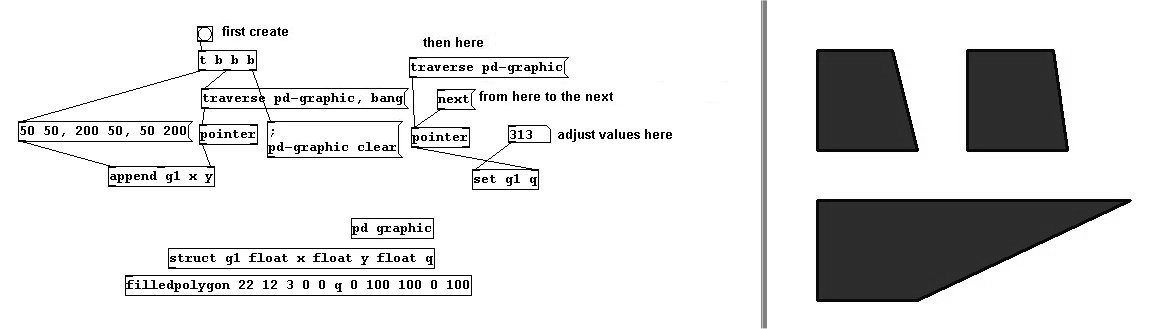
...but also by using "set". This must also receive the information from the pointer regarding the position where something is to be changed in the subpatch. In this case, it is one step after the beginning. Use "traverse pd-graphic" to go all the way to the beginning. The beginning is empty; use "next" to go to the next graphic. Now you can enter a value for q in the left input.
patches/5-2-3-1-data-structures3.pd
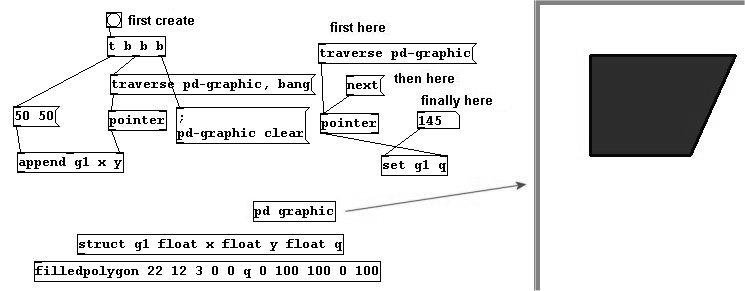
Many graphics can be made simply by sending messages to "append". Use "next" to move from one graphic to the next.
patches/5-2-3-1-data-structures4.pd
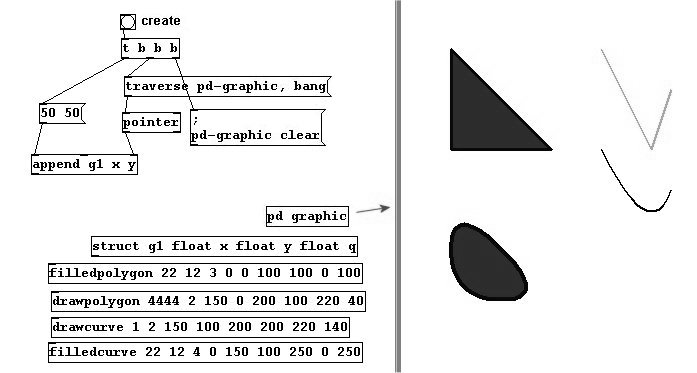
Regarding the other graphic elements: "drawpolygon" is just a line with angles; the first argument with the interior color is omitted. The same is true of "drawcurve", except that its angles are rounded. "filledcurve", however, results in a closed shape and the first argument is again reserved for the interior color.
patches/5-2-3-1-data-structures5.pd
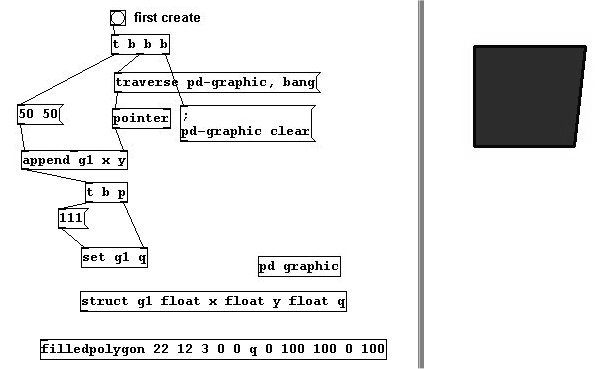
Another important point: the points (vortices) of a graphic that have variables can be changed with the mouse; the cursor changes its shape at the point, meaning you can now click and drag to modify the graphic's shape.
If you use "append" to design a graphic object, the output is a new pointer for this new object (as with "next"):
patches/5-2-3-1-data-structures6.pd
A pointer is a type of information, e.g., for "trigger":
patches/5-2-3-1-data-structures7.pd
You can use "get" to receive information from graphic elements that are attached to pointers:
patches/5-2-3-1-data-structures8.pd
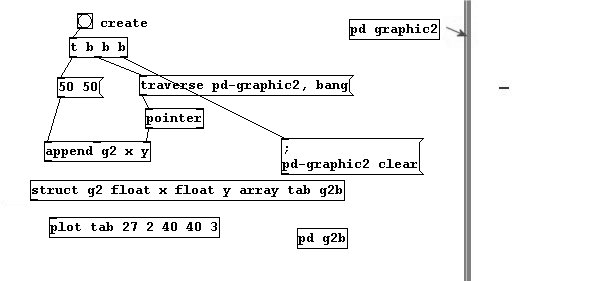
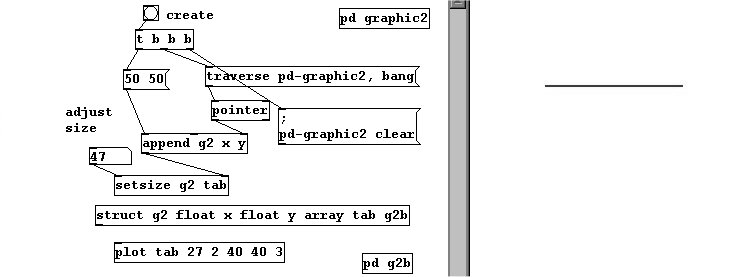
Last, you can create a (graphic) array using data structures. The array is defined in "struct" with a name and another allocated template. Use "plot" to define the color, width, starting point (x/y), and distance between points for this array.
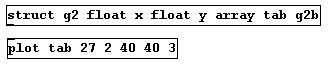
Another subpatch must contain the other template that determines the array's variables:
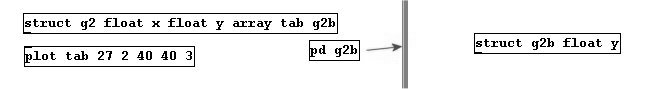
The variable "y" is automatically understood as the height of the array. This variable is necessary to create the array correctly.
Here is the created array:
patches/5-2-3-1-data-structures9.pd
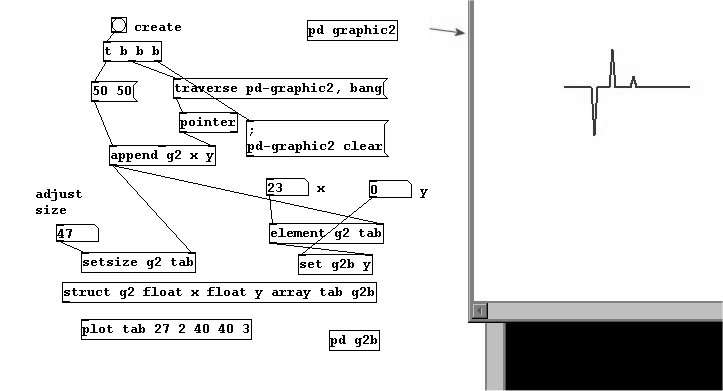
You can change the size with "setsize":
The variable "y" has to be changed somewhat indirectly; use "element" to access it.
The form of data structures may change in the future (date of writing: June 2008). Furthermore, additional special functions for data structures can be found in the original Pd documentation.
As mentioned previously, there is an additional program for Pd called GEM that is used for video generation and editing.